Counter-Narrative to the Decline of the Electric Utility
Overview
The US electric utility industry is in a period of fundamental transformation. Weak sales growth coupled with the rise of renewables [1] and distributed generation [2] has led many to believe that the traditional utility business model is untenable. Over the past decade, energy utilities globally have returned a mere 1% to shareholders; a stark contrast to the performance of a broad global index of corporate performance which returned 55% over the same period. [3] In June of 2018, Moody’s downgraded the sector noting that “utilities continue to spend significant capital” even as retail demand has eroded and cash flow has weakened significantly. The prevailing industry narrative suggests disruptive forces are increasing in significance. Depressed natural gas prices, continuing flat demand and the rapid adoption of new energy technologies seem likely to keep the mature business model of utilities under pressure for many years to come.
Although this narrative appears accurate in the short term, the long-term outlook for the industry is bright. The electrification of the transportation and heating sectors will likely present real growth opportunities for those that survive the struggles of the current difficult operating environment. Moreover, the utility industry is a necessary participant in efforts to bring about a low carbon economy.
What follows is an overview of the markets that utilities operate in and how these markets have begun to change over the last decade. I'll then examine several forward-looking growth strategies and opportunities utilities may engage in. Finally, I'll look at AES Corp., Vistra Energy, and NRG Energy, three investor-owned utilities, to examine how their business model may handle the uncertain road ahead. What makes this examination particular interesting is that each company has chosen to allocate their capital in remarkably different ways, providing a window into their respective management teams strategy to handle current volatility and capitalize on future growth opportunities.
It is too early to tell how the utility industry transformation will unfold, but it’s helpful to have a grounding in how we got here, to identify the weakness in the current system and the strategic bets that companies are making on future growth. There will be fruitful equity investment opportunities in the future, but one will have to separate the wheat from the chaff and tolerate significant uncertainty before the rewards are reaped.
Unsustainable Trajectory – A Background on Electricity Markets
Utility deregulation began in the US in the late 1970’s and focused on the unbundling of generation, transmission, and distribution infrastructure. The result was the introduction of wholesale electricity markets, open access to transmission infrastructure, competitive generation procurement and retail choice. Today, approximately two-thirds of the US market is deregulated with the remaining one-thirdof utilities operating as vertically integrated entities in regulated markets. [4]
Due to the bifurcation of the “regulated” and “deregulated” corners of the country, firms that own power plants face significantly different market conditions depending on where they operate. [5] Firms operating in wholesale markets (“de-regulated”), compete for the opportunity to sell energy into live auctions where the supply curve consists of hundreds of generating assets bidding their marginal cost of production (primary fuel cost) against daily demand in a particular region. Once equilibrium is reached, auction participants receive the market clearing price of electricity, regardless of their bid. [6]
In regulated regions of the country, utilities are often vertically integrated, owning the entire supply chain from power plants all the way down to the distribution lines feeding into retail customer houses. Utilities that earn a portion of their revenue from retail electricity sales can amortize the cost of power plant operations across their retail population. Regulated power plants often face far less financial strain than their contemporaries operating in de-regulated markets as the revenue stream to recover variable operating costs is likely fixed as opposed to being exposed to daily auctions where the price can fluctuate dramatically.
If retail sales are growing, and the marginal cost of electricity is not artificially reduced by subsidized generation, the utility industry, in both regulated and “deregulated” markets, will remain healthy. The problem is that both conditions are under threat by three forces acting on the market:
1) Low natural gas prices
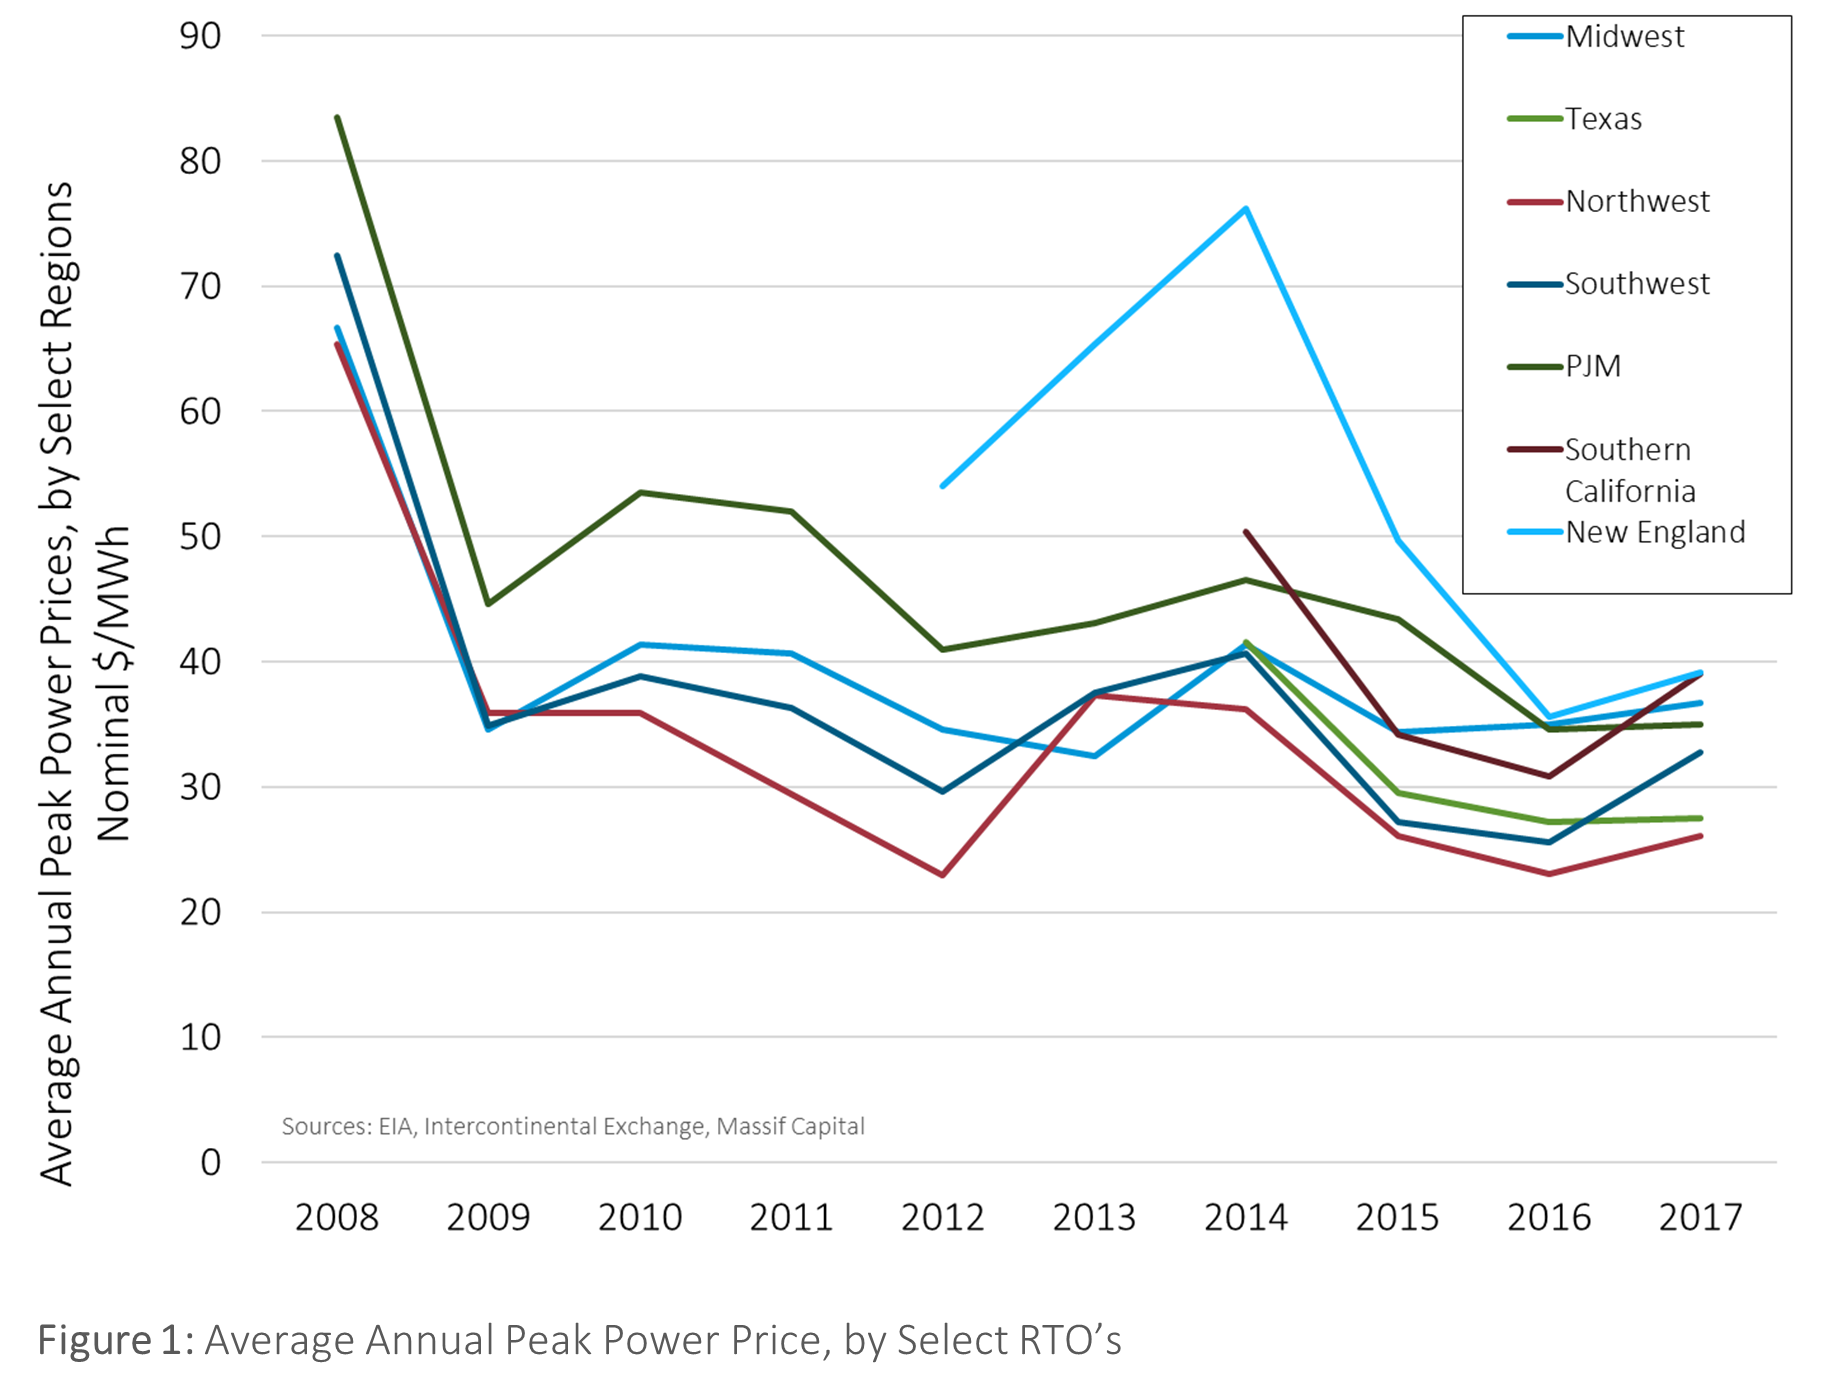
The decrease in the spot and forward gas prices that began in 2010, accelerated in 2011 – 2012 [7] and has persisted since has caused significant portions of regional electricity generating capacity to switch from coal to natural gas. As generator’s marginal cost of production is predominantly determined by fuel cost, the fall in natural gas prices has significantly decreased electricity prices and resulted in tighter margins, especially for coal-fired power generators. As a result of the financial strain, many coal-fired generators have been forced to retire certain power plants as their bids to operate were consistently out of the money. [8] While the increase in renewables has contributed to falling prices (shifting the supply curve left with the inclusion of more zero marginal cost capacity), the decline in natural gas prices has had an impact on wholesale prices almost 25x greater. [9] The average peak price of electricity in 2008 was ~$70/MWh. Today, the average price is ~ $30/MWh. Although utilities operating in both regulated and “deregulated” markets have been impacted by fall in natural gas prices, power producers that sell into wholesale markets have been the most impacted.
2) Flat demand growth
Tepid electricity demand and weak retail energy sales growth is an ongoing secular issue and currently the greatest threat to the existing utility business model. The regulated utility industry is predominantly a cost of service model meaning that costs are recovered through energy sales. The business requires demand to grow, and forecasted demand is bleak. In the face of declining unit sales, it is becoming increasingly difficult to attract the investment necessary to maintain an aging domestic power plant fleet and build new power plants. From 1958 to 2008, there were only two years of negative retail sales growth in the utility industry. We are currently on pace to have eight years of negative growth in the last ten [10]. Since 2007, domestic electricity consumption has contracted by an average of 0.2% a year. [11] The US is not alone in this phenomenon: end-use electricity consumption declined in 22 out of 28 EU countries between 2005 and 2014. [12] The EIA Annual Energy Outlook projects that net electricity sales between 2018 to 2050 will grow at an average annual rate of just 0.7%, significantly below the historical average. [13]
In the 2013 PJM [14] Interconnection capacity auction, the market cleared at 170 GW of demand with a reserve margin [15] of 20.3%, implying actual retail electricity demand of 140 GW. In the 2017 auction, the market cleared with an implied demand of 134 GW, representing a negative 1.2% compounded annual growth rate from 2013-2017. The decline in demand has caused capacity prices to decline which in turn threatens the financial stability of many utilities. Similar trends have occurred in New England and New York. The Independent System Operator in New England has seen demand decline by 0.5% over the past three years. Demand in New York has fallen by roughly 4% over the same period. [16] Texas (which has a “deregulated” utility market of its own called ERCOT) is the only market in the country right now experiencing positive demand growth, largely attributable to the resurgence of E&P drilling and production. [17]
Perhaps the largest contributor to flat retail growth is the persistent rise in energy efficiency (EE). I think that EE’s impact on electricity markets will continue to be significant for many years. LED penetration is still low with an approximate 8% adoption rate. The limited penetration of LED lighting is important as close to 15% of the total US power demand comes from lighting. With an expected increase from 8% to 25% by 2020, markets are forecasted to see a 4% decline in power demand, holding all else equal. [18]
1) The rapid growth of new energy technologies:
Innovation in material science, engineering, and economies of scale have drastically reduced the price of renewable energy in the last decade. Since 2009, the total cost for an installed residential solar system has fallen by 60%, while the cost for utility-scale systems has dropped by 70%. [19] While declining costs are positive for broader de-carbonization efforts, the introduction of a zero-marginal-cost resource has flattened the electricity supply curve which, all else equal, results in lower marginal clearing prices. In combination with flat or declining demand (shifting the demand curve left), wholesale prices in “deregulated” markets are facing significant downward pressure. That does not bode well for independent power producers selling energy in “deregulated” markets.
The declining prices do not bode well for renewable asset developers either, as most rely on long-term power purchase agreements (PPA) that generally go to the lowest cost producer. The rise of renewables has been the sole growth story in the utility industry for the last five years. Since 2014, renewables have accounted for 50% of the newly installed capacity on an annual basis, peaking in 2016 at 62%.[20] Operational improvements, increasing economies of scale and lower investment costs continue to spur further deployment. However, the fall in PPA pricing has squeezed developer margins, and it’s not clear, in the absence of storage, how sustainable the race to the bottom of the cost curve is. The value of a solar power purchase agreement contract has fallen by 77% in a decade. The fall in contract values has often occurred at rates faster than the falling price of the systems themselves. [21]
Low natural gas prices and increasing utilization of zero variable cost resources during the last decade have resulted in a 46% drop in wholesale electricity prices (See Figure 1). When coupled with a shrinking retail base over which to amortize capital expenditures, utilities are not only incapable of growing but may struggle to remain solvent.
Paths Forward
Some may argue that the spread of renewables is well worth the pain in the utility sector. Although this may be true in the long run, it is a shortsighted argument today. In the absence of storage, there is a limit to the percentage of power from renewables that the electricity grid can handle before an additional MW becomes more expensive. Because renewables are a variable resource, backup power, and quick-start generation are required to keep the grid stable, both of which are typically expensive to run and have a more significant environmental impact than more traditional baseload power generation on a per MW basis.
The National Renewable Energy Laboratory (NREL) found that the US electric grid can handle 30% renewable energy before the cost to maintain reliability becomes more expensive than the value it provides. California has found that for solar to hit 50% of statewide generation the state needs 30 GW of storage capacity.[22] To put this in perspective, approximately 0.25 GW of storage capacity was added to the grid in 2017 in the entire US. [23]
Utilities will need to play an important role in storage adoption to reach an installed base that can further facilitate renewable energy penetration. While renewable energy continues to depress the price of power and threaten their near-term profitability, utilities will remain integral if we are to accomplish the long-term objective of decarbonizing the US energy economy.
The forward-looking strategies outlined below are time-dependent, and while they will play an important role in shaping the electric future, they are also dependent upon the speed and adoption of electric vehicles and grid-scale storage.
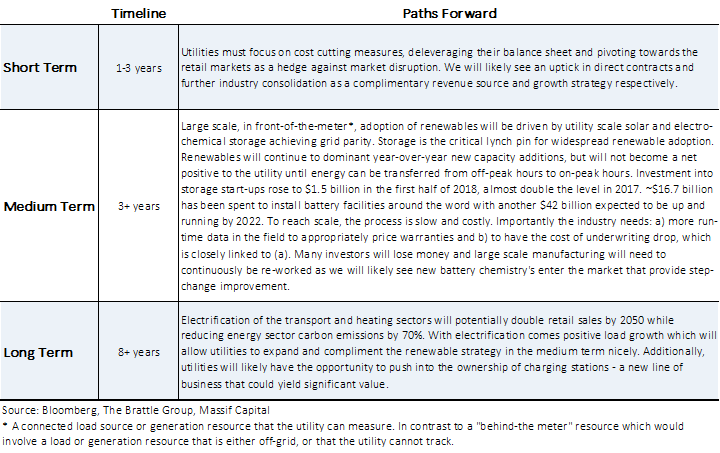
In the near term, I see the utility industry approaching a trough of indeterminate length. I believe that there will be several more tough years ahead as retail demand growth remains stagnant (due to improved energy efficiency), renewable energy continues to place downward pressure on prices and costs associated with utilities pivoting towards new strategic objectives mount, which will inevitably be accompanied by substantial impairments and write-offs of legacy assets that no longer address utility needs.
As battery storage technology matures, I see an opportunity for utilities to begin to lead renewable energy deployment as the cost of incorporating a variable energy resource declines. In the long term, a healthy renewable base will be an excellent complement to the electrification of the transportation and heating sectors, transitions that will produce substantial growth in retail demand and a dramatic reduction in atmospheric emissions.
Utilities Response
Against a backdrop of eroding revenues and secular trends applying disruptive pressure, utilities are being forced to allocate capital today that will create significant path dependency for their future corporate strategy. Interestingly, despite increasing industry consolidation, there is also a significant divergence in corporate strategies. The table above represents our view on how a utility may successfully navigate the road ahead. Below, are three publicly traded utilities that represent a sample of the diverse strategies companies are pivoting towards.
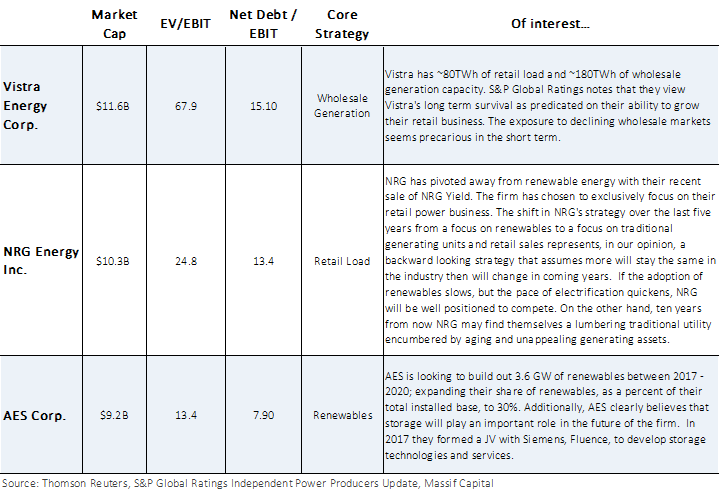
Vistra is doubling down on their wholesale market exposure via their acquisition of Dynegy. Of the three firms listed above, they appear least concerned about the pace of change in electricity markets and content with riding the volatility of wholesale market prices. ERCOT, the primary market Vistra sells electricity into, does not appear to be showing signs of any near-term price improvement despite the positive load growth. The recent Dynegy acquisition does help the firm diversify its sales into the Northeast and adds a limited number of retail customers, but not enough to improve the bottom line. In the long term, there are limited scenarios in which the cost of wholesale power rises substantially enough to improve operating margins. From our perspective, this means management will likely need to continue to shift focus to growing their retail sales business.
NRG appears very concerned with the integrity of wholesale markets. The firm has made significant commitments towards deleveraging and cost cutting, much of it at the behest of activist investors. In the process, the firm has shed significant renewable energy generating capabilities, resulting in a laser-like focus on retail energy sales via traditional coal and natural gas power plants. This will likely give the firm a competitive advantage in the short run as it pertains to cash flow visibility, but it may weaken the company’s long-term viability in a decarbonizing and increasingly distributed power environment. How the market reacts in the short to medium term to the dogged persistence of a known utility strategy in a rapidly changing energy landscape will be interesting to watch. The firms’ exposure to wholesale markets is limited, which we view as a positive both in the short and long term. The lack of renewables may come back to haunt the firm though, and a require a significant capital investment in the future to catch up with more diversified peers.
AES has made the most substantial move into renewables when compared to peers and are targeting 30% of production from renewables by 2020. The firm’s recent partnership with Siemens to develop complimentary storage technologies and services is a further indication of their long-term commitment towards renewables. AES does have a strong retail base to rely on in the short term which gives them the optionality of pursuing a robust renewables portfolio. I believe AES is going to be well positioned for future growth opportunities.
[1] Renewable generation (including hydropower) increased 14% in 2017 to 717TWh, representing 18% of total US generation, double the contribution from renewables a decade ago. It is worth noting that much of this significant jump was driven by a rebound in hydro (up 13%) due to higher reservoir levels in the West Coast, highlighting a fascinating knock on effect of draughts in that region of the United States. Renewables now contribute nearly as much electricity as the nuclear fleet. Source: 2018 Sustainable Energy in America Factbook, Bloomberg New Energy Finance.
[2] Distributed energy is best understood by reference to individual solar panels on residential housing, it may come in other forms but that is the most descriptive example. Distributed energy represents a source of electricity generation other than centralized large industrial scale developments.
[3] “How utilities can keep the lights on”, McKinsey & Company, May 2018
[4] The process of “deregulation” spread slowly across the US over 30 years and was abruptly halted with the unfolding of the Enron market price manipulation scandal and rolling blackouts in California. Regulation and deregulation are kept in quotes throughout the paper as one must recognize that even in “deregulated” regions of the country, the industry is still heavily regulated.
[5] Retail consumers often have very little visibility into the regulatory structure upstream of their electrons – the electricity from Consolidated Edison (ConEd) in New York and Duke Energy in North Carolina may appear the same, but their business models couldn’t be more different. ConEd sits in an independent system operated region called NYISO, which manages the distribution of electrons to consumers while purchasing their power in an open market. Duke Energy sits outside of the purview of a system operator and is vertically integrated with diverse assets on their balance sheet spanning everything from generation to retail meters.
[6] Wholesale market are in fact of comprised of three separate markets; ancillary services, energy markets and capacity markets. Variable operating costs are often recovered in energy markets while capital and fixed costs are recovered in capacity markets. Capacity markets are unique to certain regions of the country and their auctions operate in a very different manner to energy markets. While the economics of power plants are greatly affected by the combination, or participation, in all three markets, the energy markets are the most liquid and relevant to highlight as it relates to revenue disruption in the utility industry.
[7] Henry Hub spot prices fell from ~$10-12 per mmBtu to <$2.50/mmBtu between 2010 and 2014.
[8] In addition to low NG prices, two major EPA rules (CSAPR and MATS) created regulatory burden and risk to the industry with respect to scrubbing technology and the CAPEX required to comply with atmospheric emission regulations. Although both regulations have played a role in the demise of many coal fired power generators, it is our opinion that Natural Gas prices and bad capital allocation decisions by coal miners has played a far larger role in the fall of “ole king coal” in the US then government regulation.
[9] “Electricity Markets, Reliability and the Evolving U.S. Power System”, Analysis Group, June 2017.
[10] Scott Madden, Duke University Energy Conference, 2017
[11] 2018 Sustainable Energy in America Factbook, Bloomberg New Energy Finance
[12] Eurostat, Strategy&
[13] Perhaps best representative of a near term forecast. While commendable, a 40-year forecast in a rapidly changing industry should be taken with a heavy dose of skepticism.
[14] Loosely defined as Pennsylvania, New Jersey and Maryland electricity market.
[15] The percentage of supply available relative to demand. In a closed system, absent storage, supply and demand must equal each other instantaneously, at all times. As demand can fluctuate, the North American Electric Reliability Corporation (NERC), as well as other operator and regulatory bodies, require a supply capacity greater than demand to handle minute-to-minute fluctuations that may threaten power reliability.
[16] Approximately 500 MW in a 11.75 GW market.
[17] S&P Global Ratings, PJM, ISO-NE, ERCOT
[18] S&P Global Ratings
[19] Department of Energy, August 2017
[20] EIA
[21] Lawrence Berkeley National Laboratory, Levelized PV PPA Prices from 2006-2017 measured in real $/MWh.
[22] NREL
[23] Greentech Media Research, US Energy Storage Monitor Q2 2018